Macro Data's Medieval Times
July real-time CPIs falling fast with gasoline prices
Macro data is stuck at Medieval Times.
Its official collection and production has changed very little since the first consumer price indexes were produced in the early 1900s.
To give one example, the earliest efforts to build price indexes focused on food, at the time a major share of household spending. And in 2022, the most detailed category in official CPIs remains… Food and Beverages, though it only accounts for about 10 percent of household expenditure.
We have extraordinary technology available to us to collect and produce real-time data, but statistical agencies have been slow to embrace it.
Inactions, just as much as actions, have consequences: We believe that a reasonable share of current inflation can be attributed to the Fed, or the Biden administration, not having the opportunity to be nimble because they’re looking at data that is manually collected, sparse, and often not transaction based.
The ongoing debate over domestic versus global causes of current inflation doesn’t let the official data off the hook, as the same issues plague CPIs produced outside the US.
This belief is why we started to build our real-time inflation indexes over a year ago and why we plan to expand our efforts to other macro series and to other sources of real-time data.
We’re delighted that the issues with how macro data are collected are starting to get more attention—see the June 24th episode of the All-In podcast and a recent WSJ piece.
Real-time CPI update
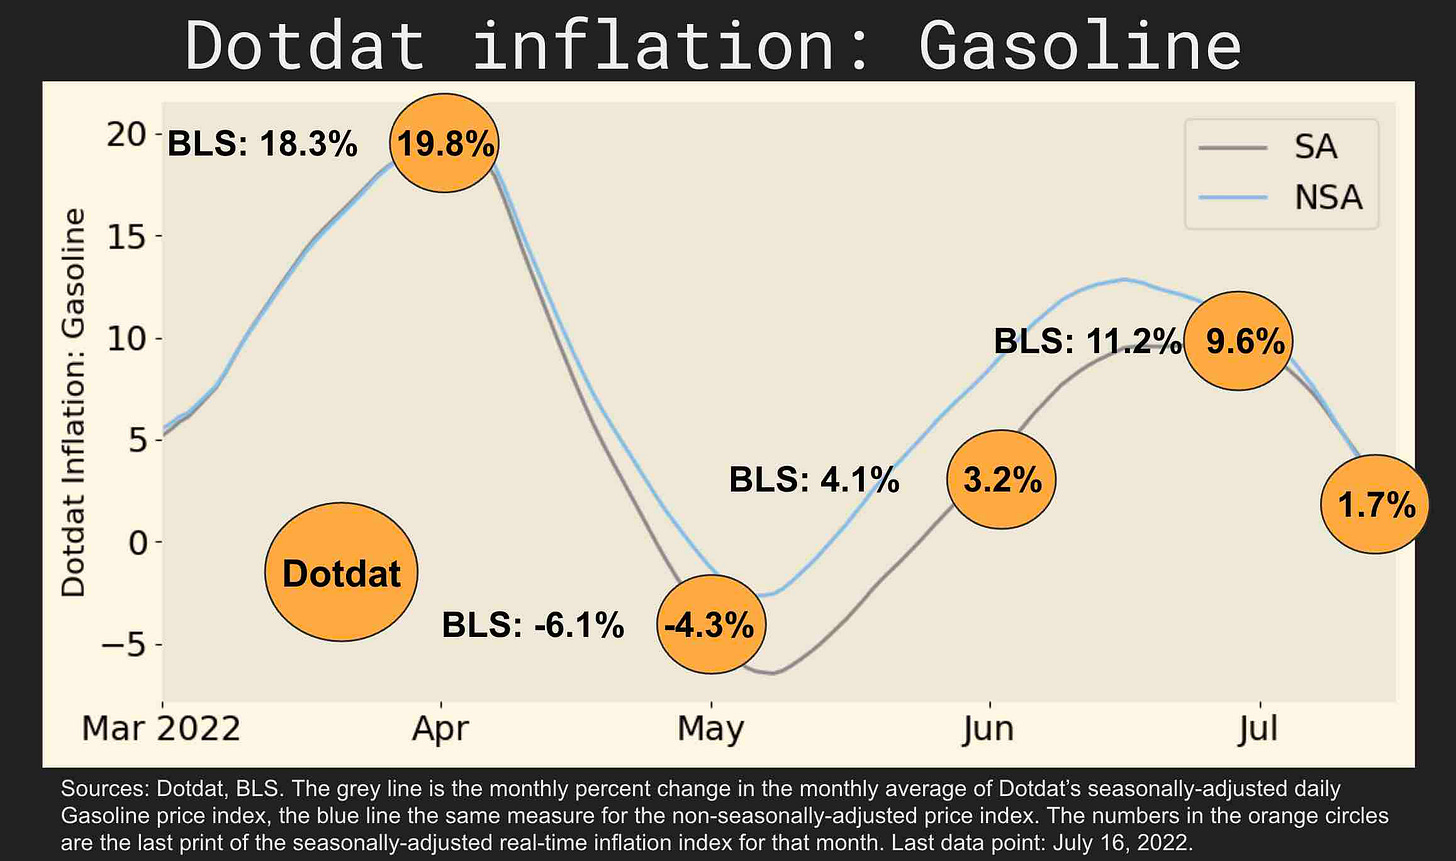
Since our last update only five days ago, we’ve seen big movements in our real-time CPIs as gasoline prices continue to fall fast.
The monthly run rate of our real-time Gasoline CPI has fallen from 4.3 percent only five days ago to 1.7 percent as of July 16th, a smidgen of its 9.6 percent June print.
The pass-through to our real-time Transport CPI has been swift and almost violent—Its monthly run rate is only 0.3 percent as of July 16th, down from 0.8 percent just last week, and from its 2.2 percent June print.
Our headline CPI is also coming down fast with the Transport CPI, and July’s print is shaping up to look more like April’s muted number rather than May or June’s runaway figures—more to come on this.
It is not all good news, as we are continuing to see pricing pressure in many services and some goods sectors, notably Apparel. Its monthly run rate has accelerated to 1.0 percent as of July 16th, up from its 0.8 percent June print, and a near-complete vanquishing of its striking weakness earlier this year.
But as Transportation accounts for most of the monthly variation in headline inflation, July is shaping up to be a more modest inflation print than we’ve seen for a few months, barring major oil or other commodity price shocks over the next few weeks. Fingers crossed.
Ready for more?


