A quick summary of how today’s CPI-U release compared to Dotdat’s real-time CPIs over June. Our ‘Alt’ inflation series anticipated this month’s official print well as the BLS’s Used Vehicle series converged back to the more stable trend in our real-time CPIs. Core Services inflation started to tick down in the official data, though partly driven by more volatile, less-sticky components.
Takeaways
June’s CPI-U prints came in broadly in line with Dotdat’s real-time data, both Headline and Core.
Dotdat’s real-time CPIs anticipated trends in Core Goods ex Used Cars well, notably continued weakness in Housing and Recreation Goods and strength in Apparel.
Core Services CPIs, and in particular, Core Housing Services, came in a bit weaker in the official than the real-time data.
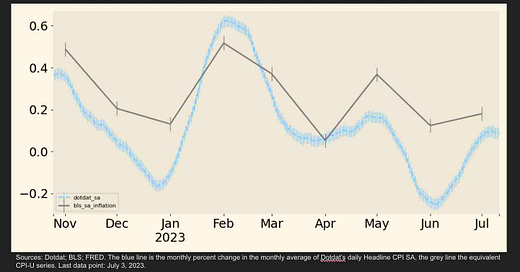
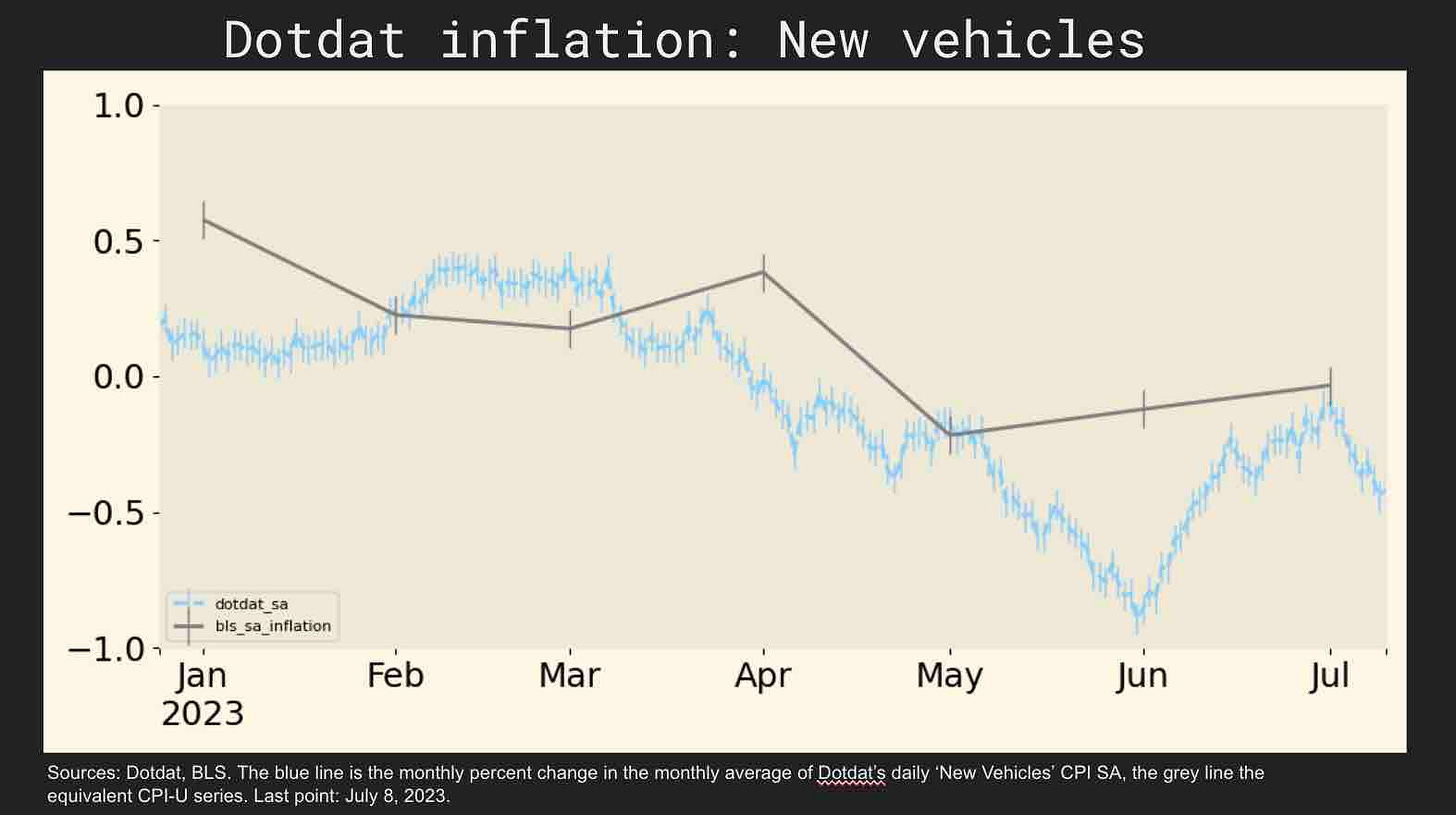
In each of the figures below, the blue line is the rolling monthly average of Dotdat’s daily CPI for that product, sector, or aggregate and the grey line the analogous BLS CPI-U series, with each of its markers pointing to the last day of its reference month.
Headline
Dotdat’s Headline CPI rose by 0.1 percent in June while the CPI-U increased by 0.2 percent.
Core
Dotdat’s Core CPI (excluding energy and food) rose by 0.3 percent in June while the CPI-U rose by 0.2 percent, following marginally stronger Core Services, and in particular, Core Housing Services CPIs in the real-time vs. the official data.
Core Services
Dotdat’s Core Services CPI rose by 0.4 percent in June after rising by 0.4 percent in May, a stable series with no signs of breaking out in either direction, while the CPI-U decelerated modestly to 0.3 percent.
Core Housing Services
Dotdat’s Core Housing Services CPI (excluding energy) rose by 0.6 percent in June, in line with its trend since March while the CPI-U ticked down to 0.4 percent with a modest (10 bps) deceleration in Owners’ Equivalent Rent.
Transportation Services
Dotdat’s Transportation Services CPI increased by 0.3 percent in June, slightly above the 0.1 percent rise in the CPI-U, following higher Airfares inflation in the real-time vs. the official data.
Core Goods
Dotdat’s Core Goods CPI was flat in June (up 0.03 percent), in line with the BLS print of -0.05 percent. The divergence between the two series in recent months had followed the unusually large increases in the BLS’s Used Vehicle series, which was an outlier among industry sources. With the June print, the BLS data appear to be converging back to the more stable trend in the real-time data—in Used Vehicles, and in turn, Core Goods and Core Inflation.
Dotdat’s Used Vehicle CPI rose by 0.7 percent in June compared to the CPI-U print of -0.5 percent.
Since late Q1, the Core Goods ex Used Vehicles CPI had captured the weakening trend across most items in both the real-time and official data. For June, the real-time CPI fell by 0.2 percent while the CPI-U came in flat, consistent with the average 20 bp gap between the two series over the past year.
In contrast with the divergence between the real-time and official Used Vehicle CPIs since the start of 2023, the real-time and official New Vehicle CPIs have tracked one another fairly closely. Dotdat’s New Vehicles CPI declined by 0.1 percent in June, in line with the flat CPI-U print for the month.
Dotdat’s Housing Goods CPI declined in June by 0.6 percent, reflecting the broader cooling in the Housing Market, and compared to the 0.3 percent decline in the official data.
Finally, Dotdat’s Apparel CPI rose by 1.0 percent in June, in line with its monthly prints since March and the stable trend of positive (albeit lower) prints in the official data.
Until August!


