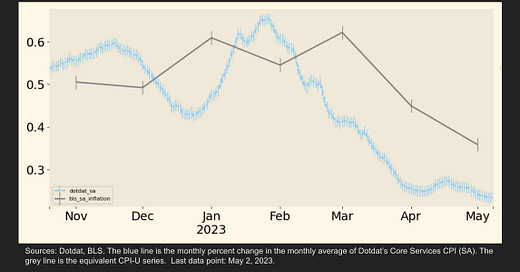
A quick summary of how today’s CPI-U release compared to Dotdat’s real-time CPIs over April. Our ‘Alt’ inflation series anticipated this month’s official prints quite well across most of the CPI’s major building blocks, notably the major development since the start of the year—a second consecutive month of slowing in the Core Services CPI. The exception to this rule: Used Cars.
We share our daily CPI data with a few clients via API. Please get in touch if of interest: hello@dotdat.io.
Takeaways
April’s official CPI release came in above Dotdat’s real-time data as expected, both Headline and Core, following a much higher official than real-time print for Used Vehicle inflation.
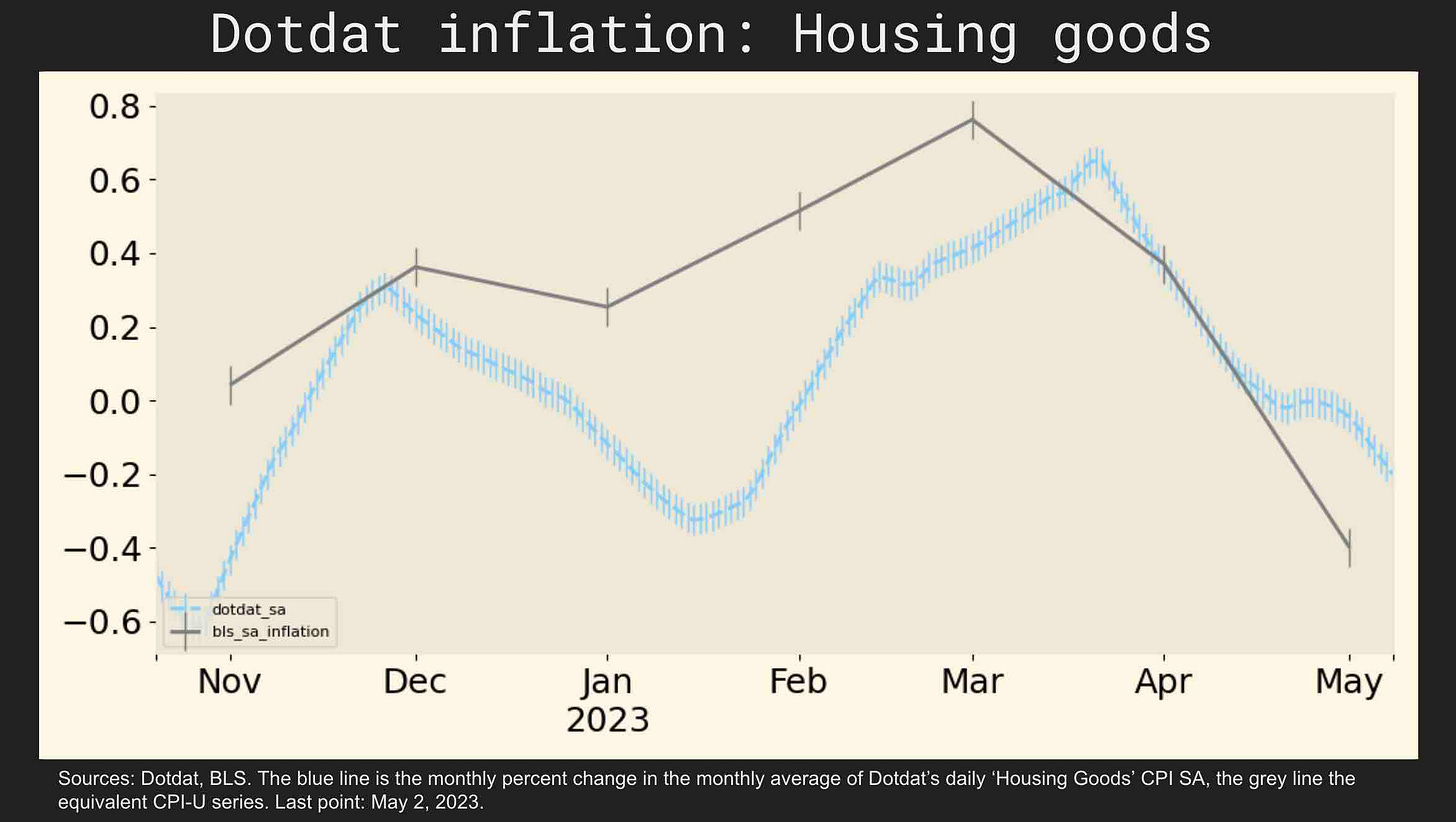
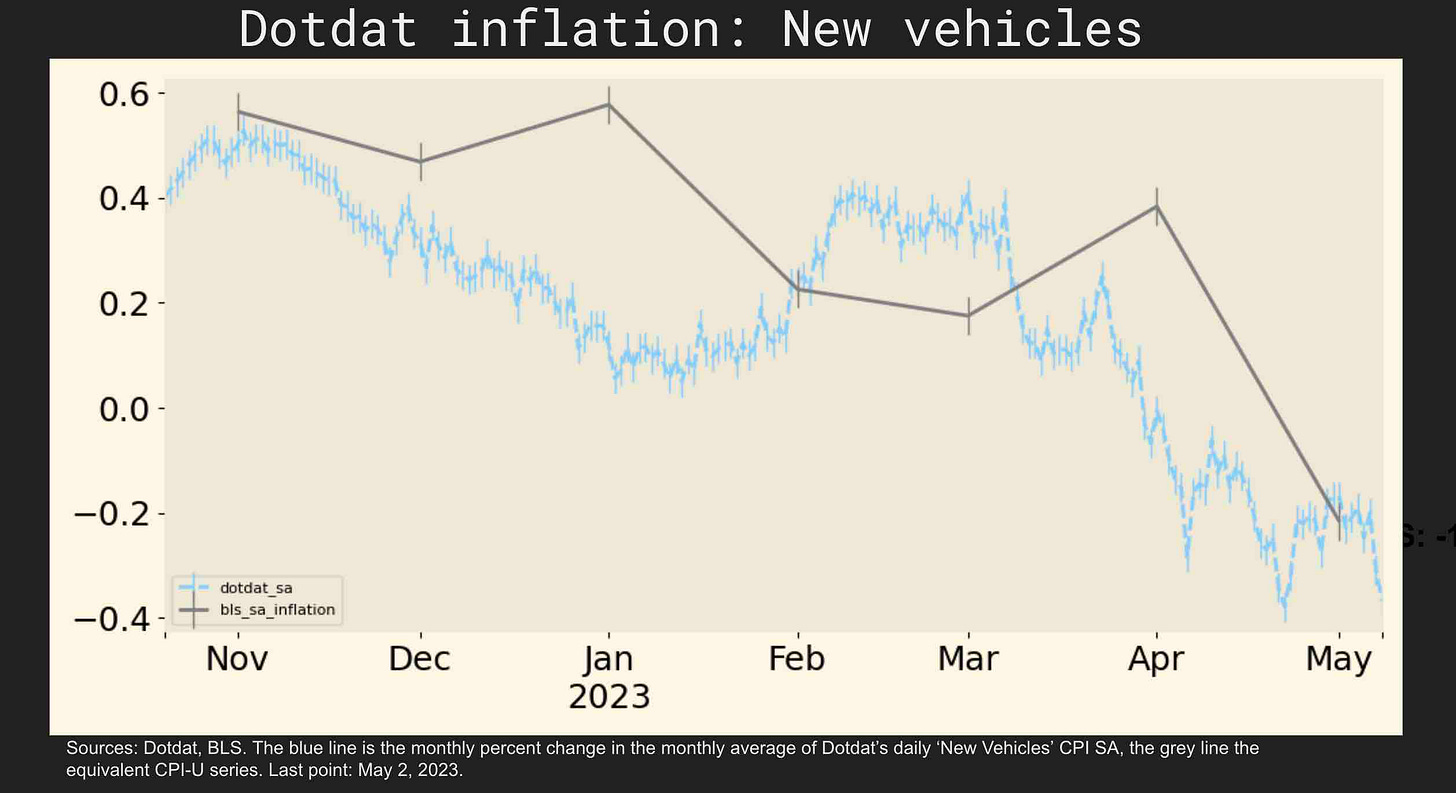
Dotdat’s real-time CPIs anticipated trends in both Core Services and Goods ex Used Cars well, notably the slowing in Core Housing Services and Transport Services, e.g. Airfares, and in Core Goods ex Used Vehicles, e.g. Housing Goods and New Vehicles.
The slowing in Core Services CPIs appears to have legs in the official data with the April print, as it has in the real-time data for the past three months.
Core Goods ex Used Cars inflation showed the same decelerating trend in the real-time and official CPIs.
Our data show Used Car CPIs declining over April while the BLS’s data show a significant increase over the month. We attribute this difference to sample selection issues and focus our review on aggregate CPI's ex Used Vehicles wherever possible.
In each of the figures below, the blue line is the rolling monthly average of Dotdat’s daily CPI for that product, sector, or aggregate and the grey line the analogous BLS CPI-U series, with each of its markers pointing to the last day of its reference month.
Headline
Dotdat’s Headline CPI came in below the official CPI-U print of 0.4 and indicated a CPI-U print of 0.3 percent after controlling for the Used Vehicle CPI and its typical run rate vs. the official print.
Core
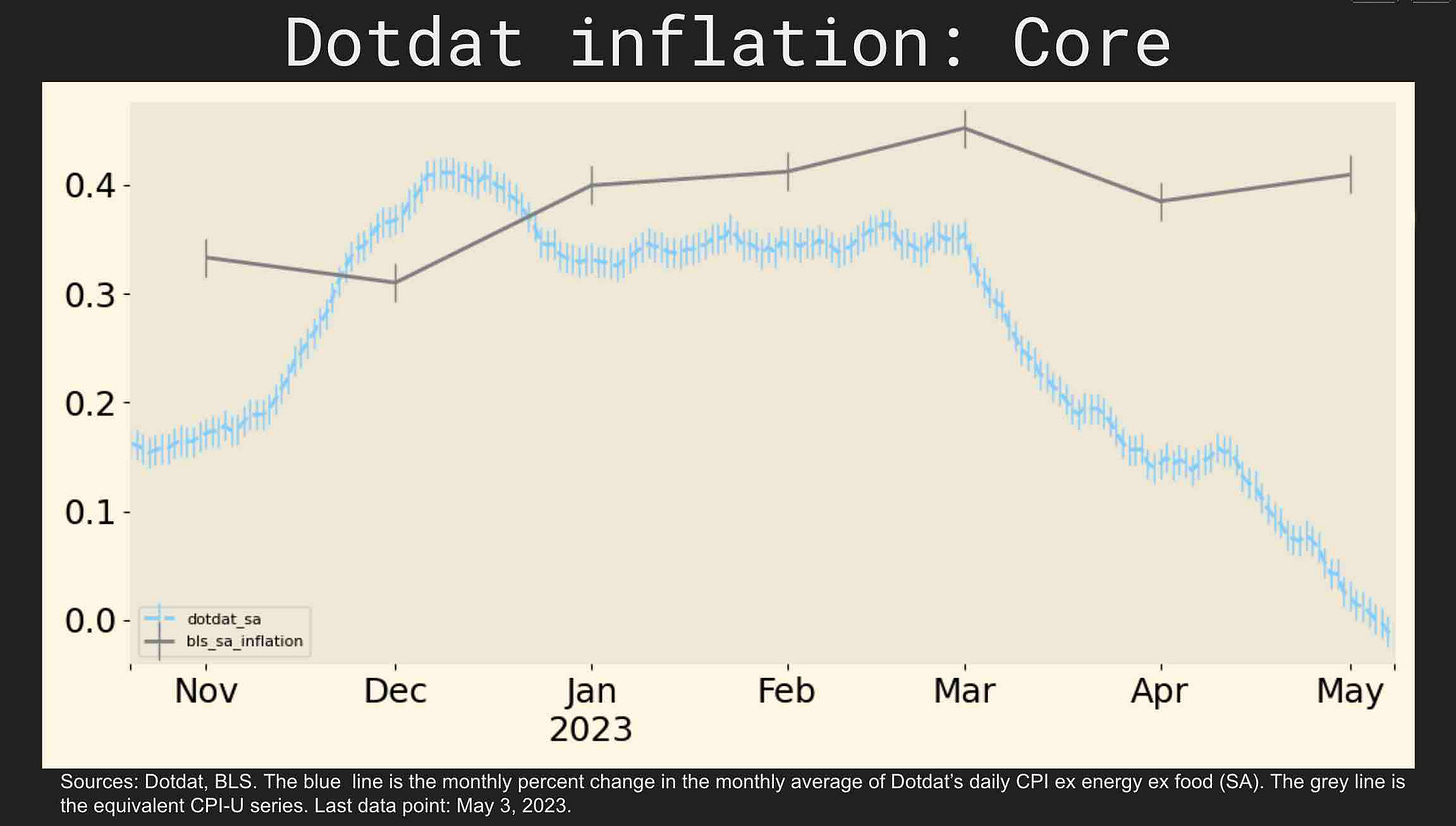
Dotdat’s Core CPI (CPI ex energy and food) was flat in April and its CPI-U estimate of 0.3 came in below the 0.4 percent CPI-U print.
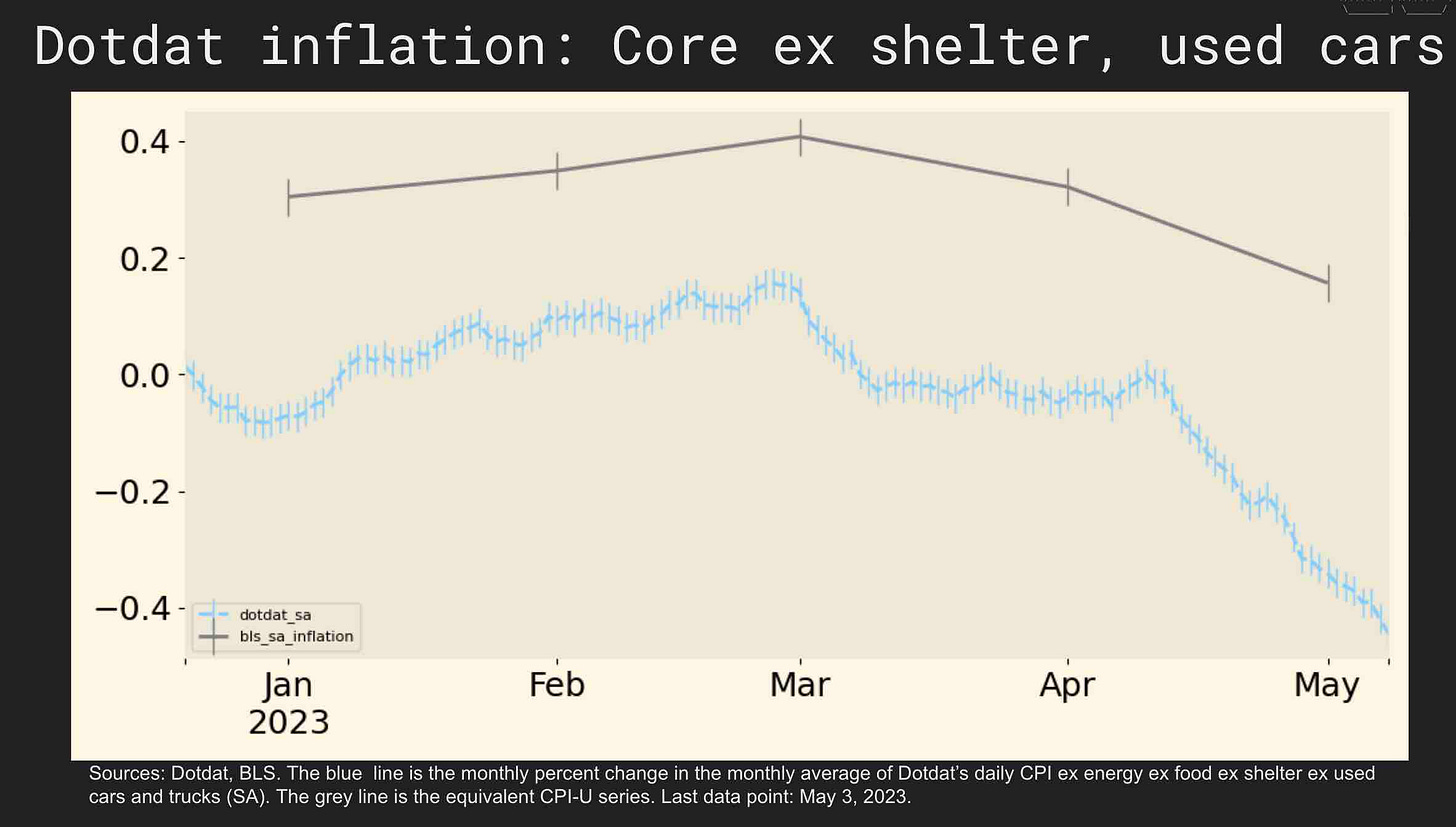
Dotdat’s Core CPI ex shelter and used vehicles matched the variation in the equivalent CPI-U series well over 2023.
Core Services
Dotdat’s Core Services CPI rose by 0.3 percent in April, in line with the 0.4 percent increase in the CPI-U. Both series have stepped down over the past few months.
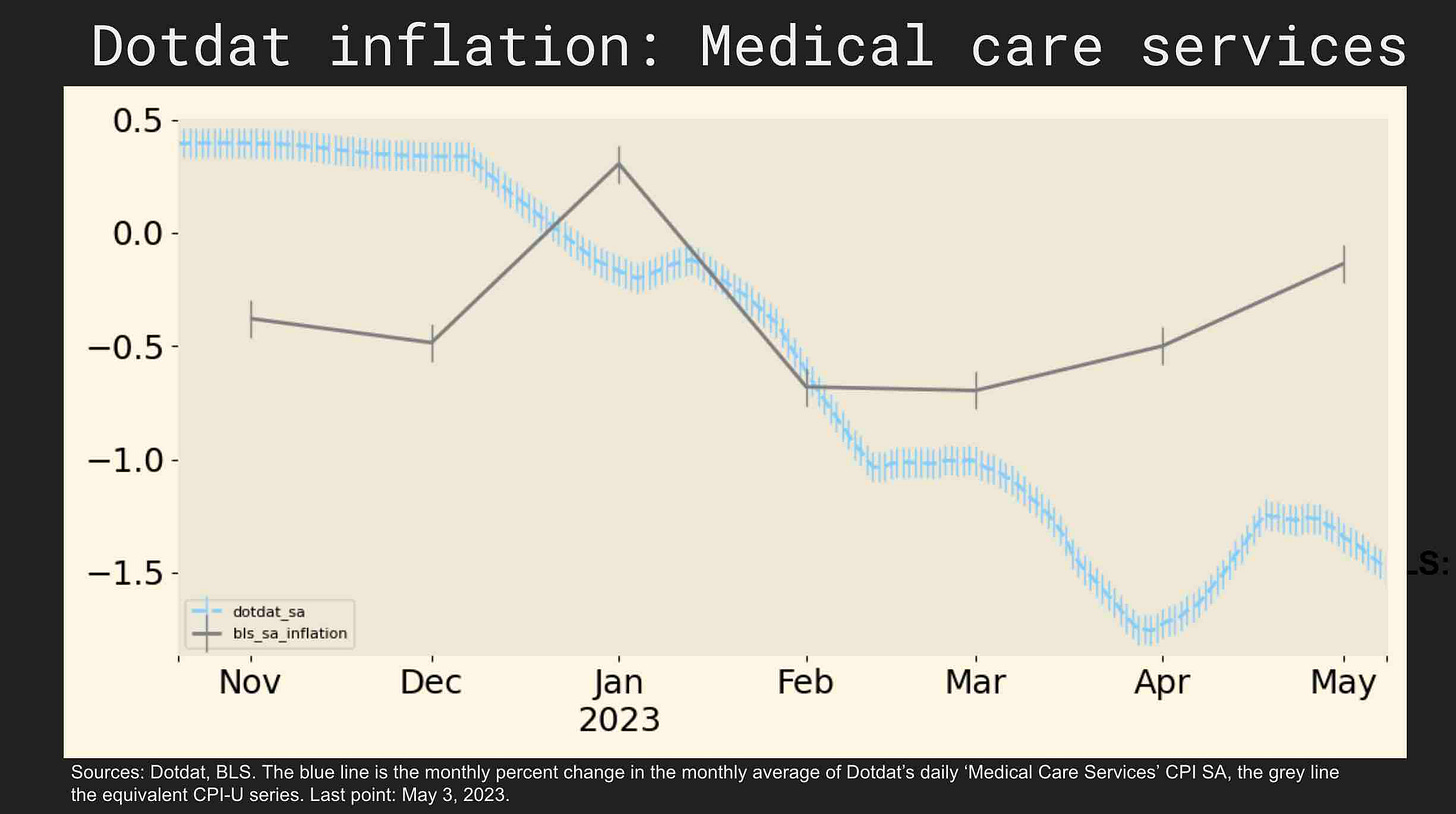
Both Dotdat’s and the CPI-U’s Medical Care Services inflation series stabilized in April at their previous negative run rates, and are no longer decelerating rapidly as in Q1.
Core Housing Services
Dotdat’s Core Housing Services CPI (housing services ex energy) rose by 0.65 percent in April, above the BLS’s print of 0.4 percent.
Transportation Services
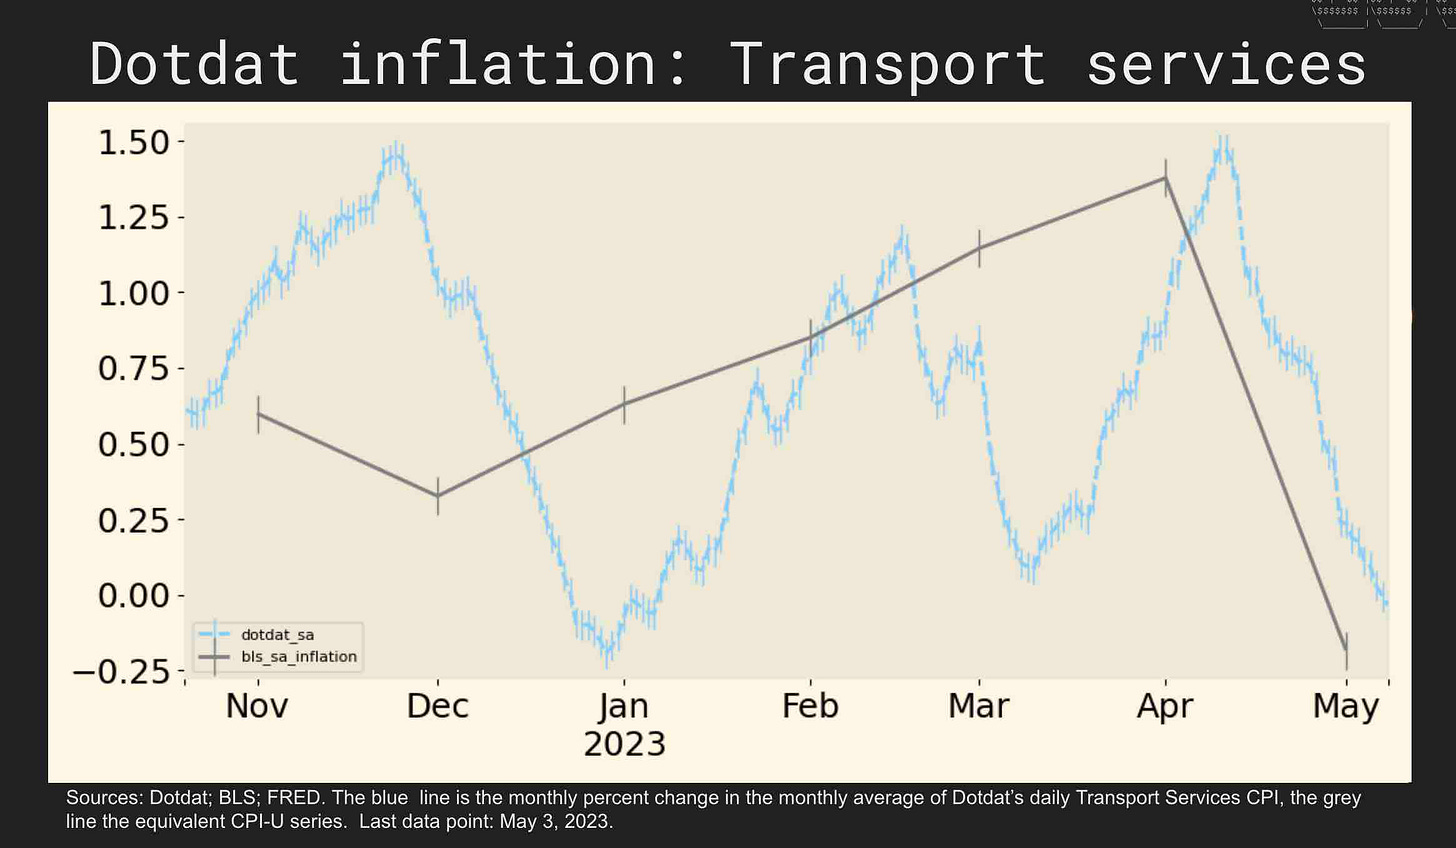
Dotdat’s Transportation Services CPI increased by 0.2 percent in April following a 0.8 percent rise in March, reflecting lower Airfares and other Services, and consistent with the significant deceleration in the CPI-U from 1.4 percent in March to -0.2 percent in April.
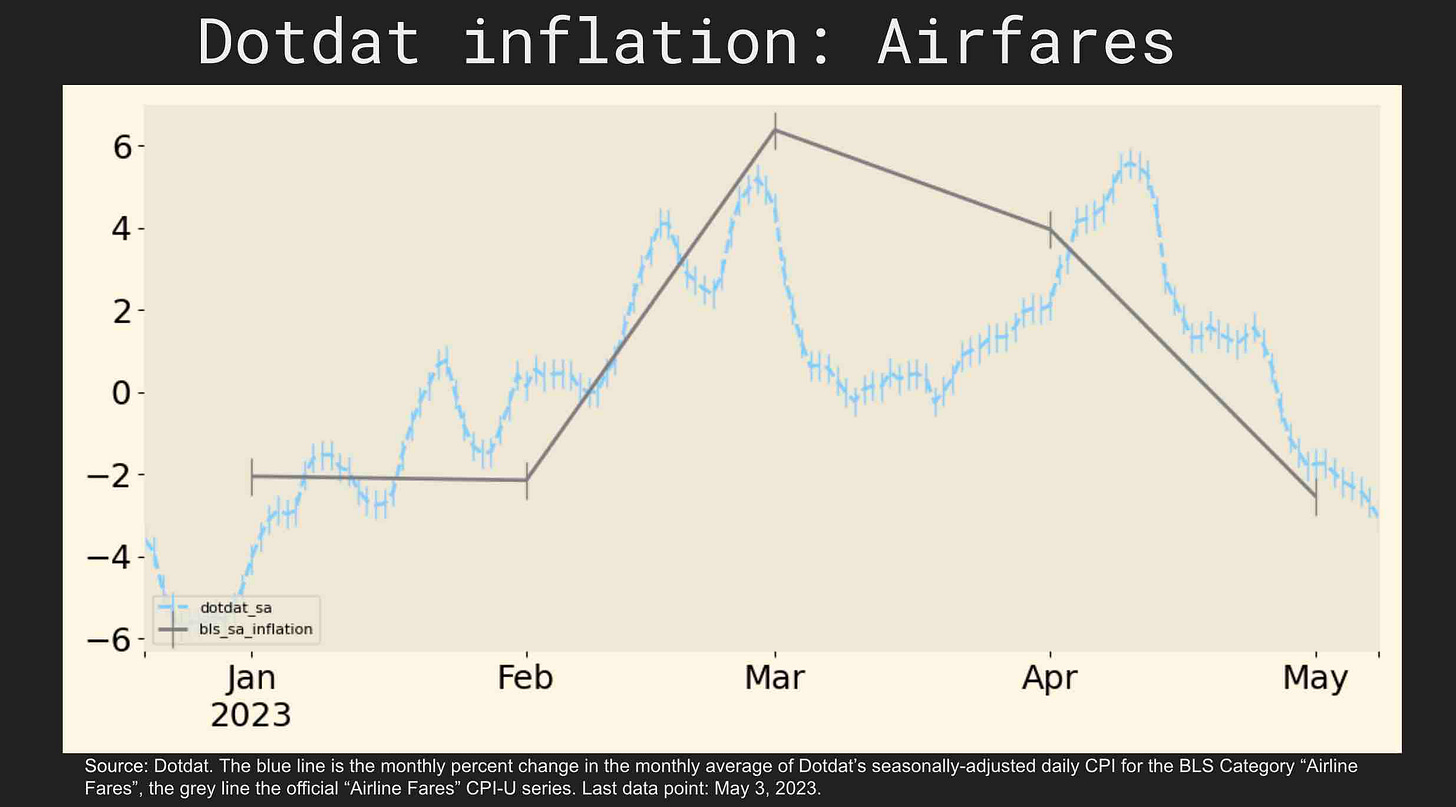
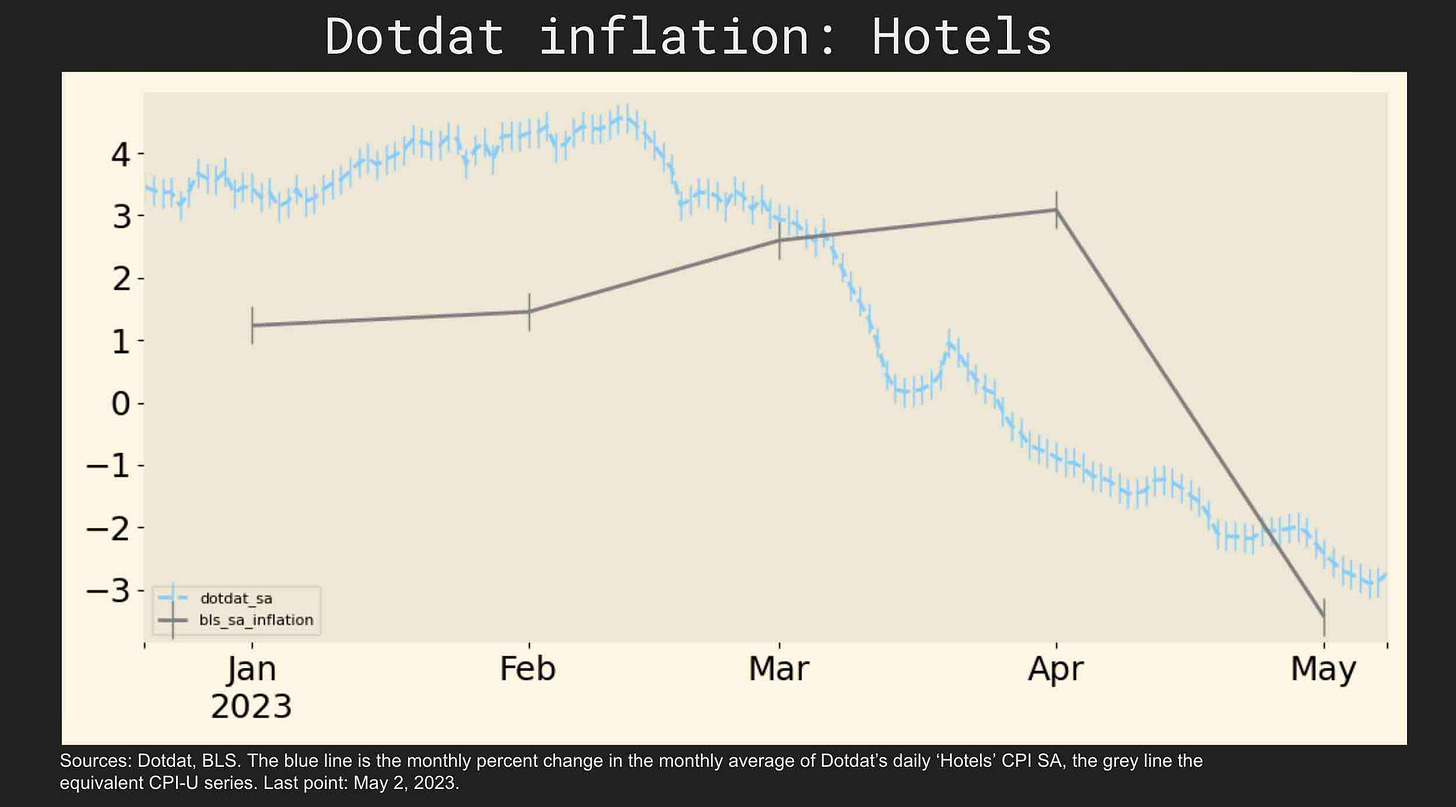
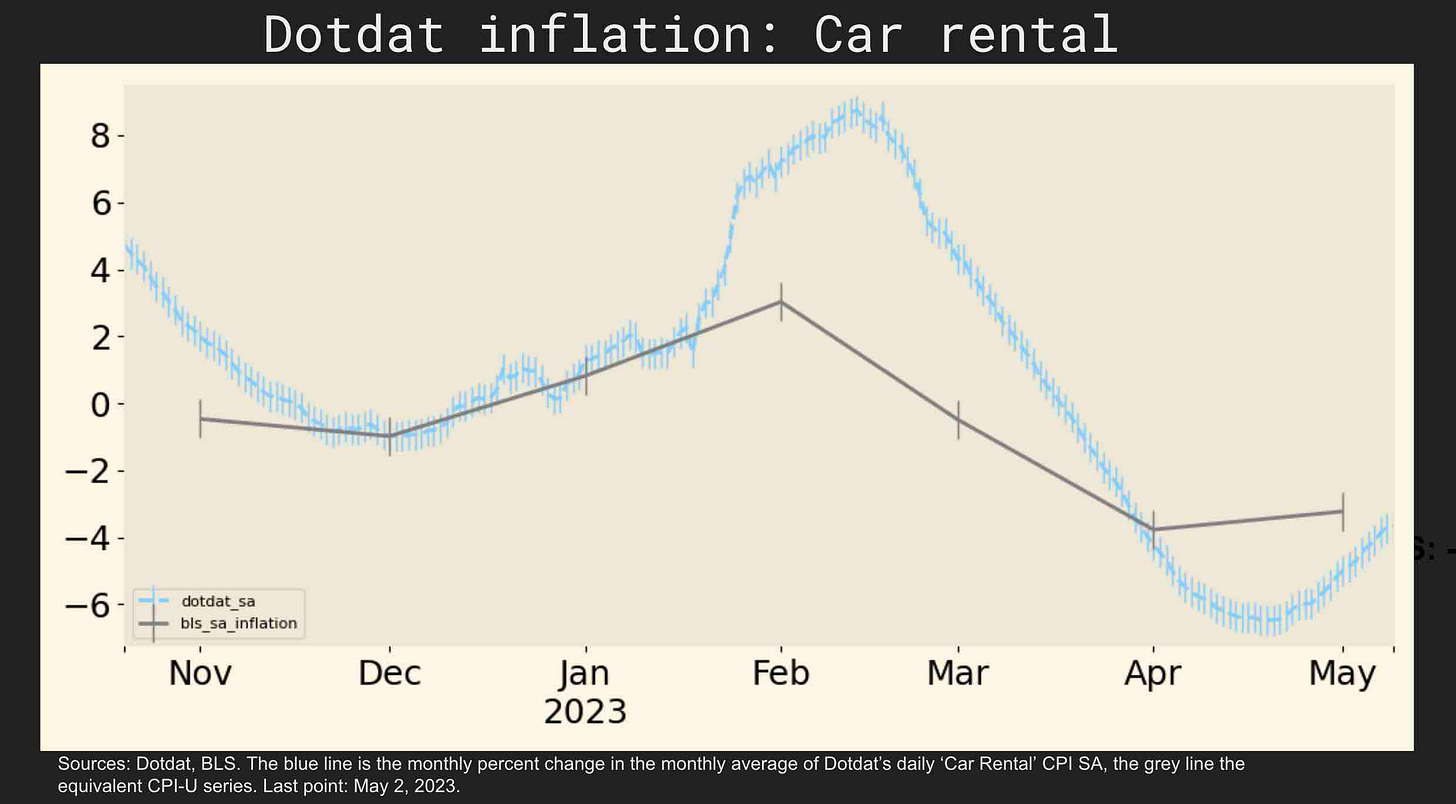
Dotdat’s Airfares CPI declined by 1.8 percent in April, in line with the 2.6 percent decline in the CPI-U. Other leisure travel CPIs also declined precipitously over April, notably Hotels and Rental Cars, as shown below.
Core Goods
Dotdat’s Core Goods ex Used Cars CPI decelerated from March to April following growing weakness in Housing Goods and New Vehicles CPIs over the month and in line with the variation in the analogous CPI-U series.
Dotdat’s Housing Goods CPI was flat in April after rising by 0.4 percent in March, in line with the decline in the CPI-U, and consistent with the broader cooling in the housing market.
Finally, Dotdat’s New Vehicles CPI declined by 0.2 percent in April, in line with the 0.2 percent decline in the CPI-U and with industry estimates.
Until June!

